Unrealized profit/losses are great for knowing what we have gained or lost so far if we were to sell everything immediately. But they are not a performance indicator.
Performance allows the investor to know how and by how much a portfolio progresses over a given period and, most importantly, to compare it to an index like the S&P 500, for example.
By going to the “Insights” section of your dashboard and portfolios, you will see your performance chart right at the top.
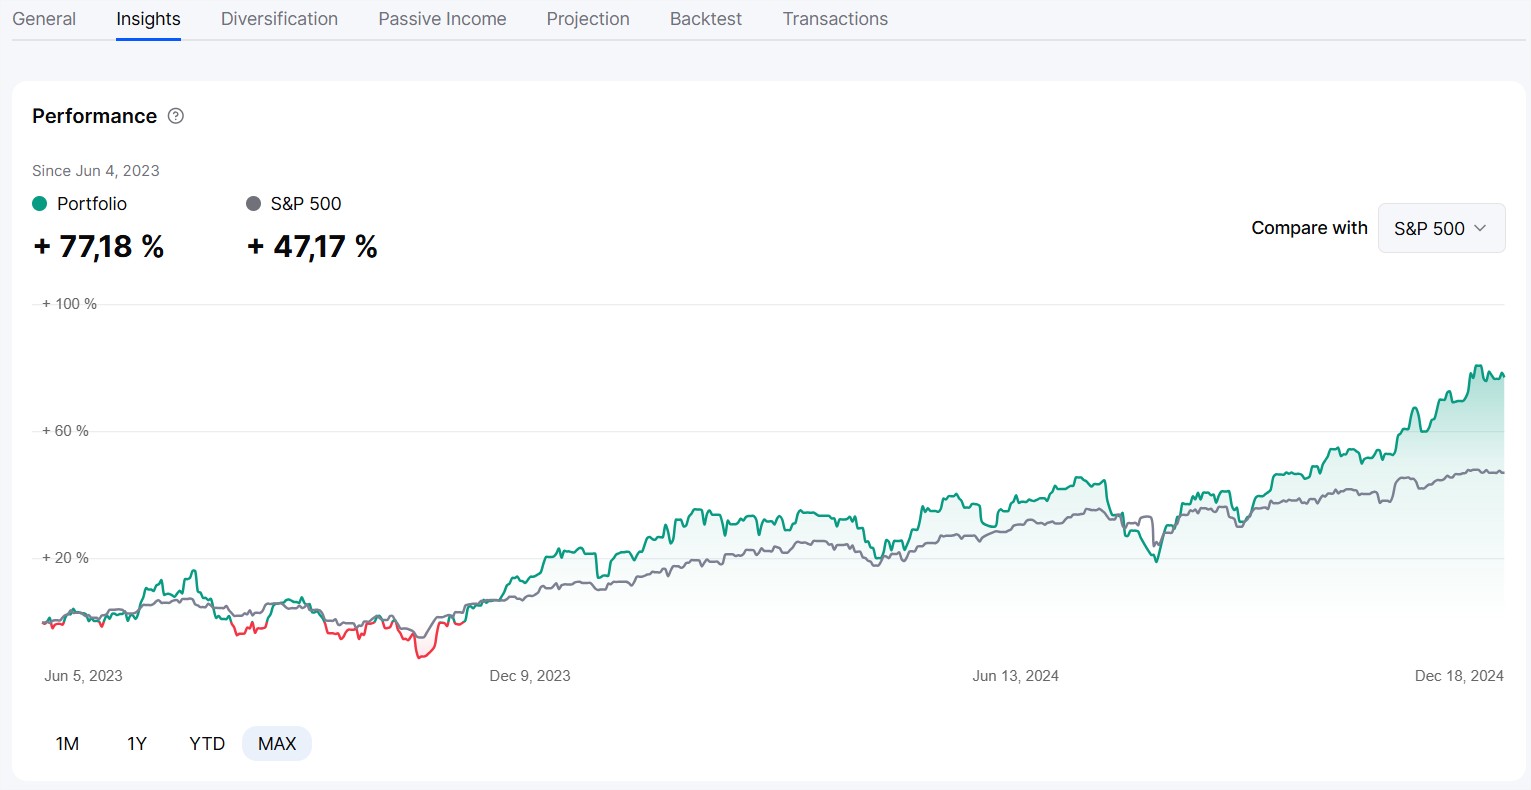
Depending on the selected period, you will see the % progression or regression of your portfolio versus that of an index (by default the S&P 500, but you can choose from about fifteen options).
In the example below, we see that the portfolio has generated a performance of 77% since June 2023 (1.5 years), while the S&P 500 (including dividends) has progressed by 47%. The portfolio thus outperforms the benchmark index over the selected period.
There are several methods for calculating portfolio performance (simple, weighted, etc.). Each has its advantages, disadvantages, and provides different results as it analyzes different aspects.
We have chosen the method of simple performance by share value. This method allows for the integration of contributions and withdrawals without penalizing the performance calculation.
Let’s take two simple examples to understand.
Example A
Your portfolio has a value of €1,000 in January 2024. You make no withdrawals or contributions during the year. In December 2024, your portfolio is worth €1,200.
The portfolio has therefore increased by €200, which is a performance of 20%.
Example B
Your portfolio has a value of €1,000 in January 2024. You invest €100 in June into the portfolio. In December 2024, your portfolio is worth €1,200.
Here, your portfolio has once again increased by €200 between January and December, but your performance will not be 20%. This is because €100 of this €200 increase is a contribution and must therefore be excluded from the performance calculation.
Your actual performance is the increase between €1,100 and €1,200, which is 9%.
We detect your contributions and withdrawals through the evolution of your average cost per share and simulate the same on the benchmark index. You see the performance of the index as if you had invested in it in the same way as in your portfolio.
Thus, the comparison between the performance of your portfolio and that of an index is fair.