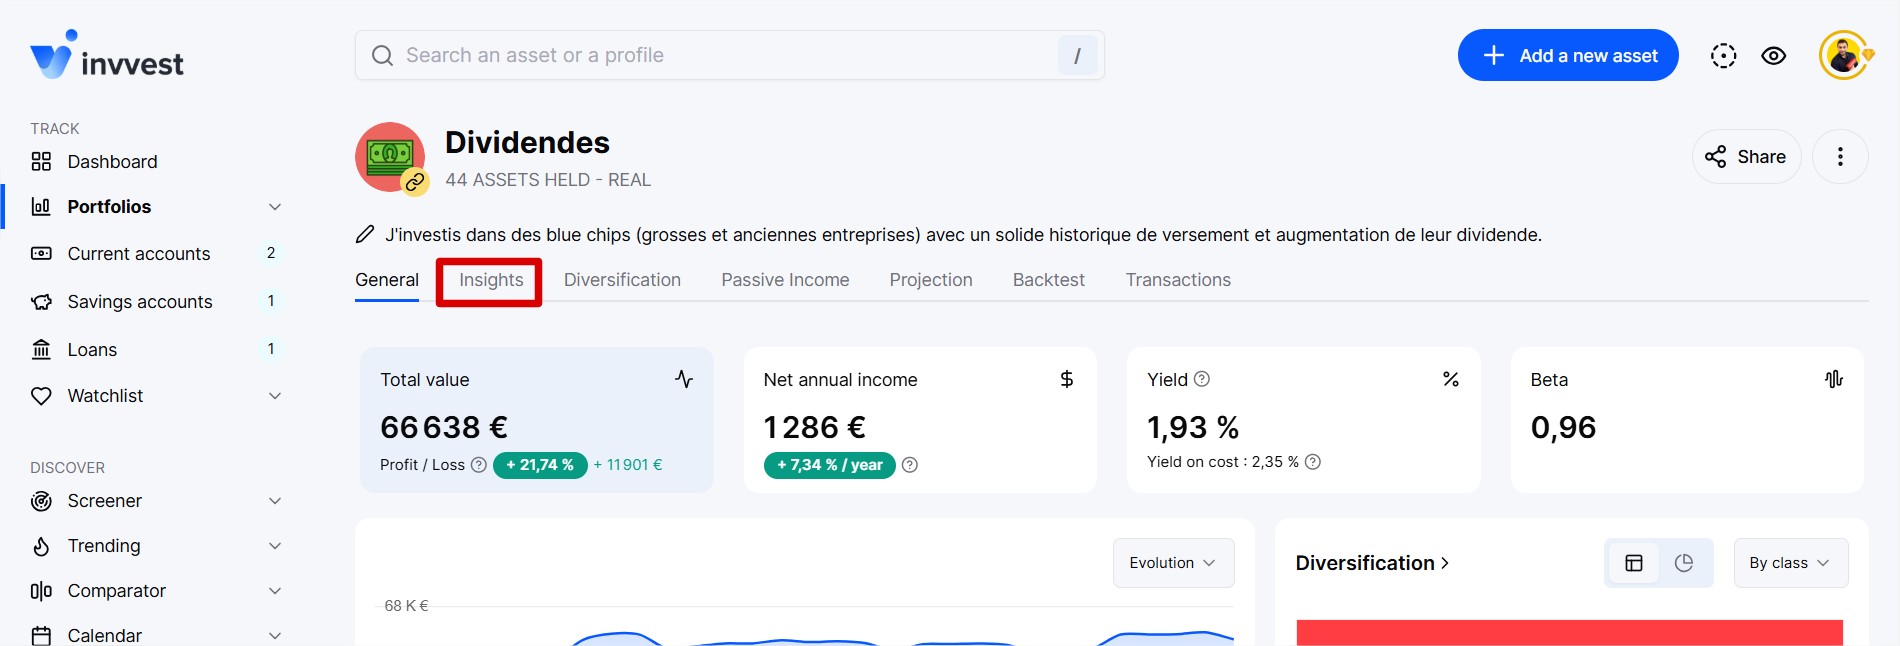
In your portfolios and watchlist, in the “Insights” section.
This chart reveals the variations between the current price of each of your assets in the portfolio/watchlist and its 200-day moving average price.
For those who don’t know, the moving average provides the average price of a value over a given period (in our case, the last 200 days). It is called moving because its calculation is performed day by day.
The moving average looks like this (in blue):
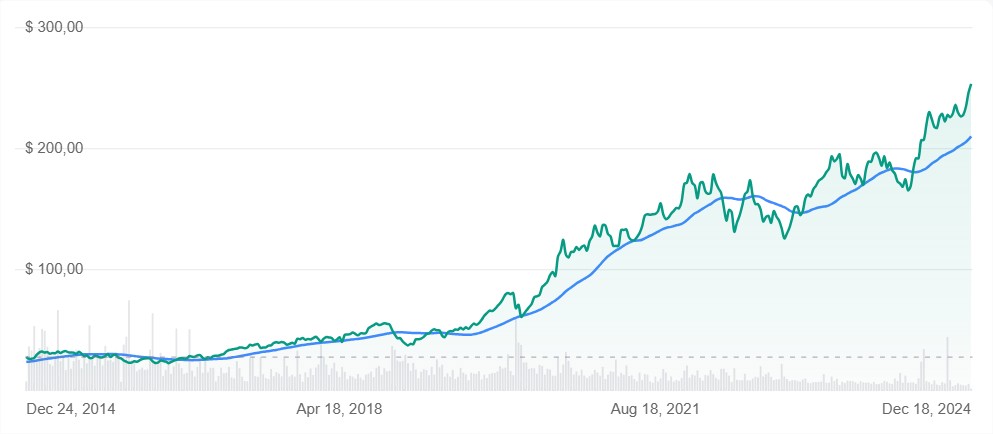
Moving averages are essentially a trend-following tool. Their purpose is to identify or signal that a new trend has started and to track its evolution.
If the price of an asset falls below its moving average, it is often a sign of a bearish trend (dip). If the price of an asset rises above its moving average, it is often a sign of a bullish trend.
We calculate the moving average of all your assets every day and determine the variation between the result and the current price, which gives us the Dip Detector.
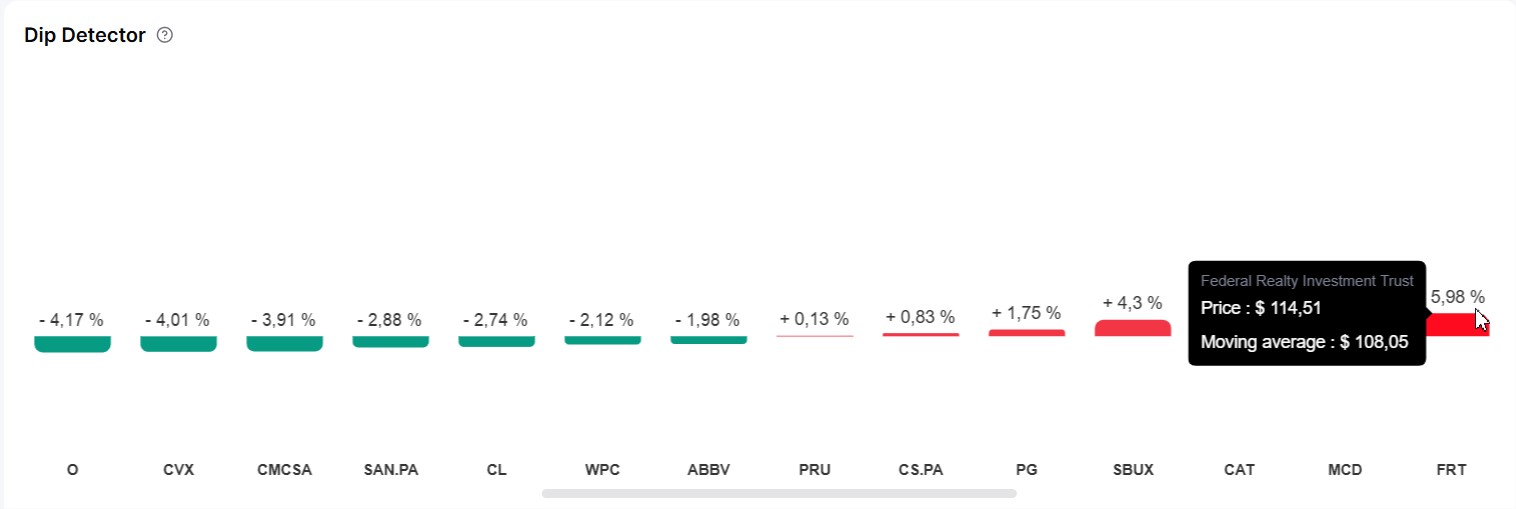
The greener it is, the more the asset is below its moving average. And the redder it is, the more the asset is above its moving average.

The idea is not to provide buy or sell trading signals. Rather, it is to help identify the potential best moments to initiate a position (in the case of the Watchlist), to strengthen, or to sell (in the case of an already held asset).
The advantage of this technical indicator is that it is one of the few that does not rely on chartist predictions but solely on historical and indisputable data.