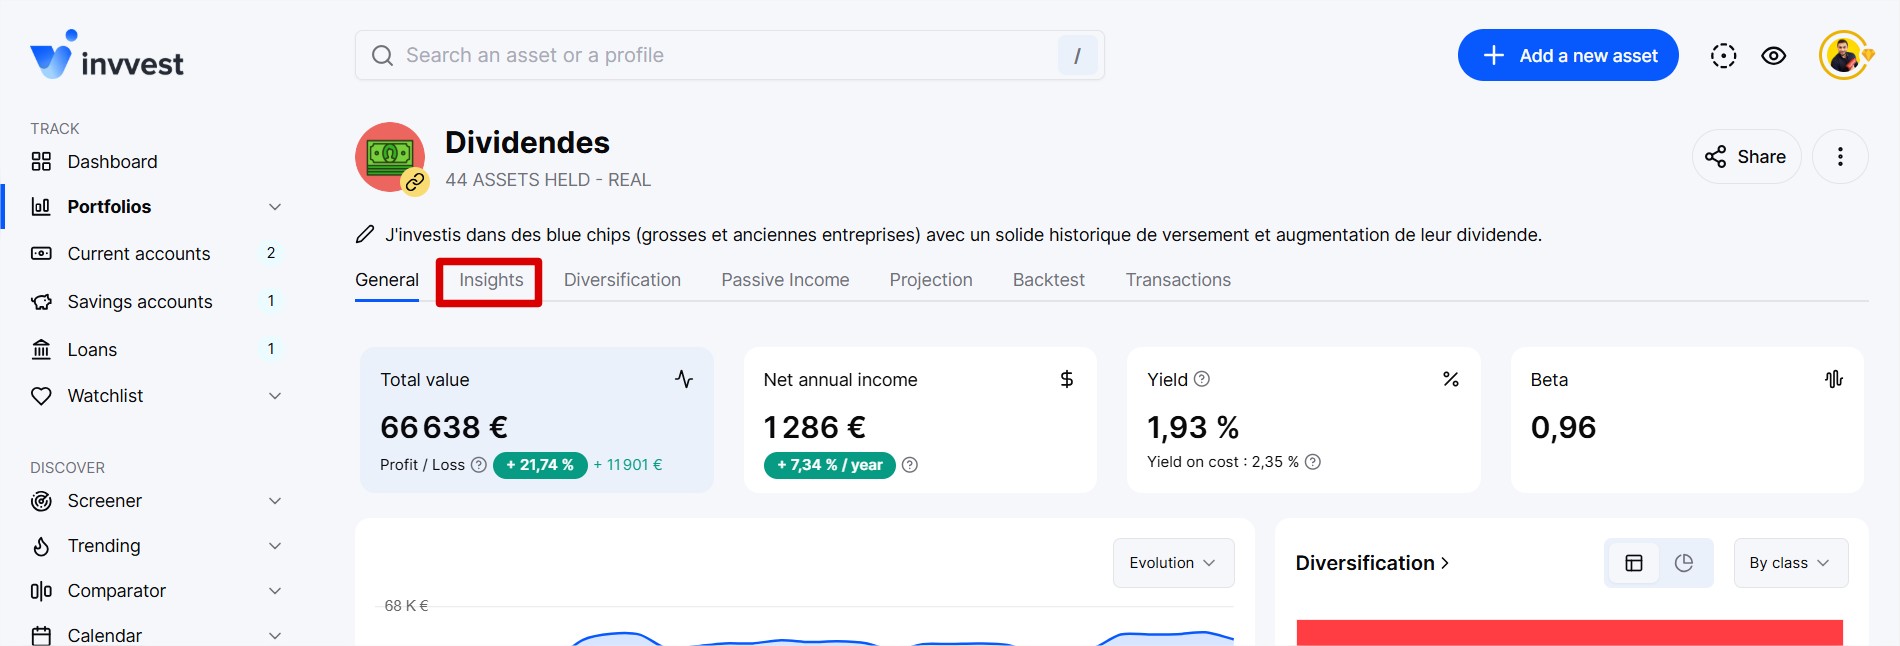
In your portfolios, in the “Insights” section, at the very bottom.
This matrix is dedicated to dividend stocks, one of the pillars of the platform. It categorizes each of your stocks into one of four yield/growth typologies.
High yield (+3% per year) / Low dividend growth (-8% per year)
High yield (+3% per year) / High dividend growth (+8% per year)
Low yield (-3% per year) / Low dividend growth (-8% per year)
Low yield (-3% per year) / High dividend growth (+8% per year)
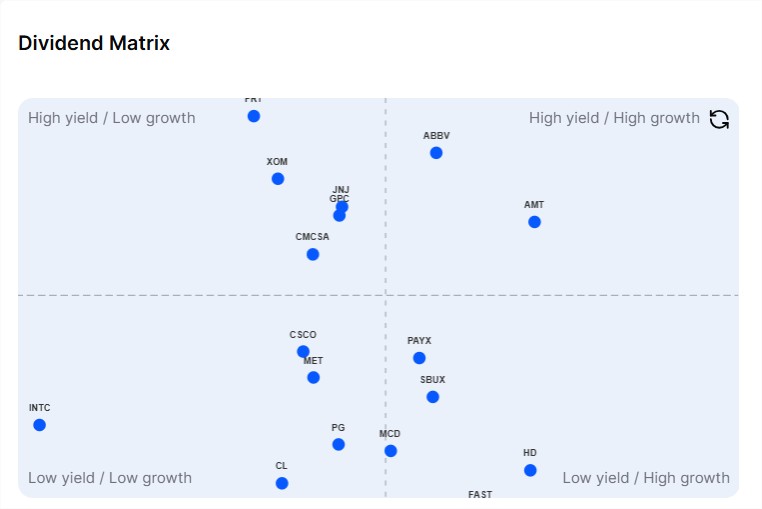
This matrix allows you to see at a glance which are your cash cows, your shooting stars, and your burdens, so you can optimize and guide your investment strategy.
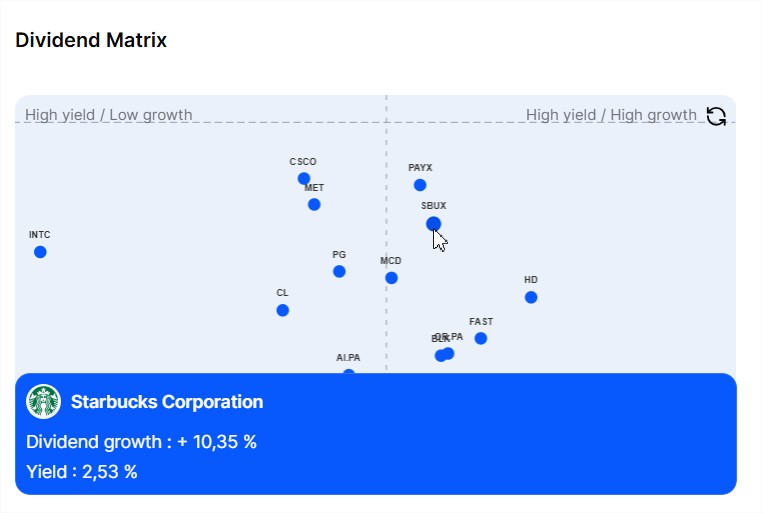
You can zoom and move the matrix with your cursor/finger and click on an action to display a tooltip containing additional details, including its annual yield and the average annual growth of its dividend (based on the last 5 years).
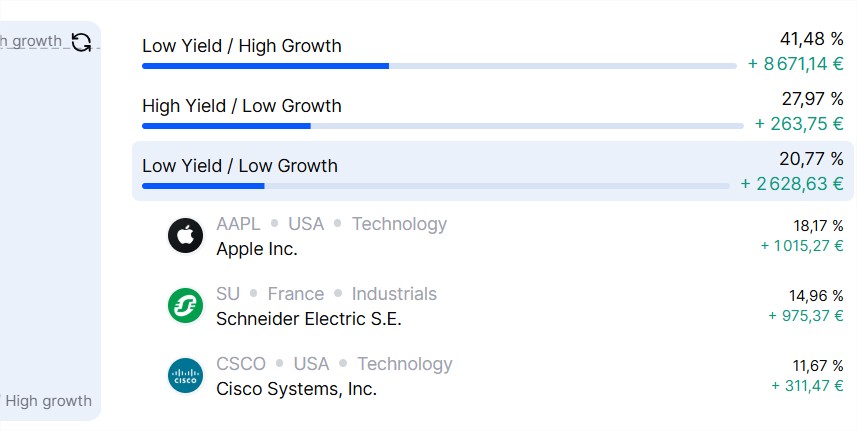
And finally, we also display your allocation grouped by typology.