In your portfolios, in the “Projection” section.
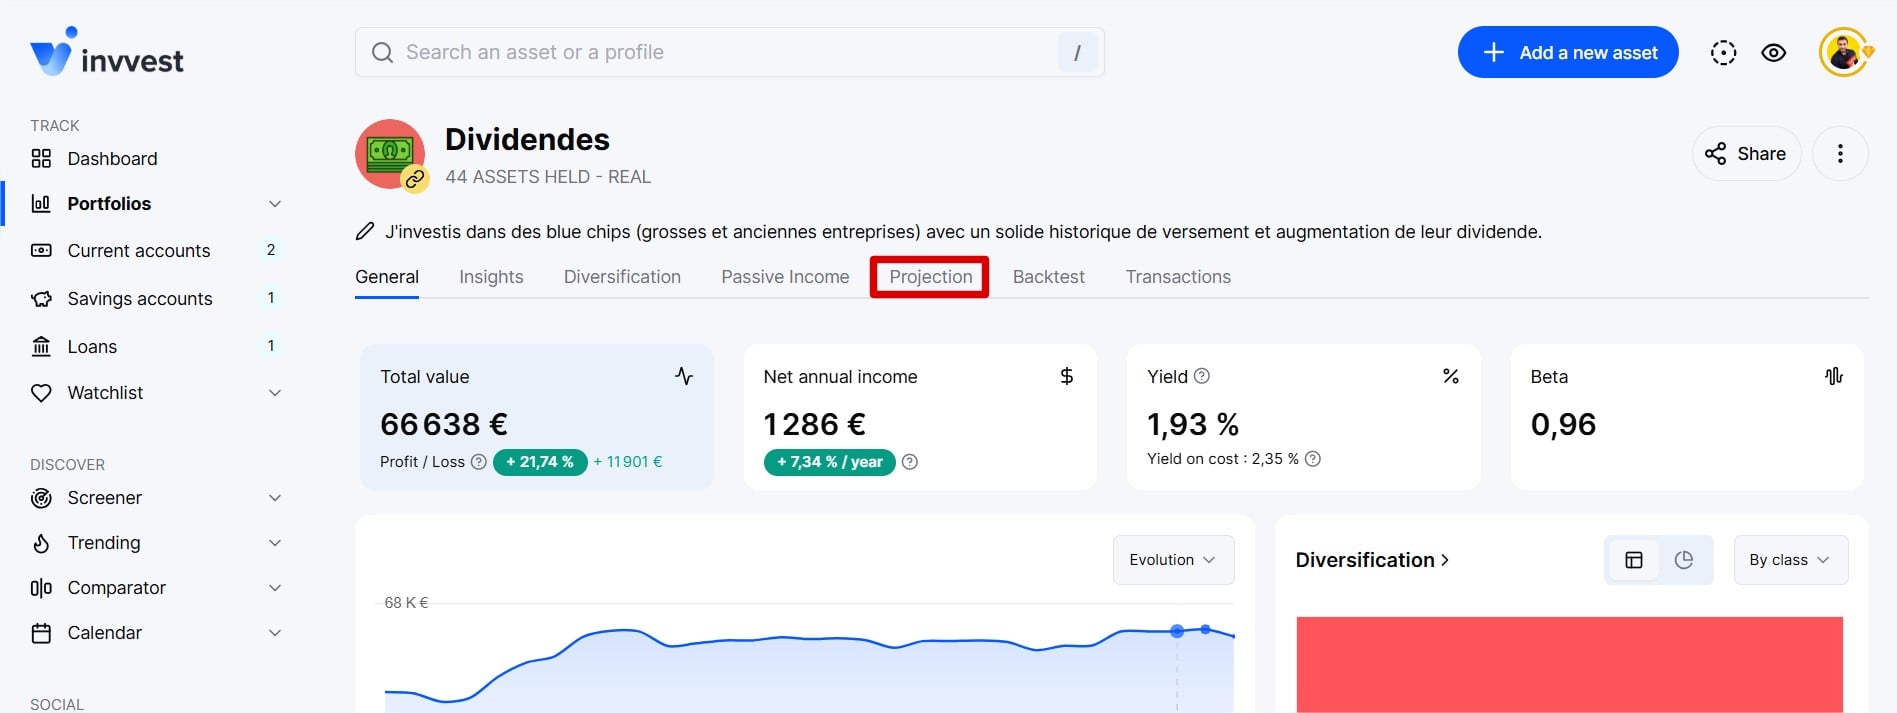
It is a future simulation of your annual income over a chosen period, based on your current income data, yield, and annual income growth.
Specifically, this projection tool allows you to know how much your annual income will be in 10 or 20 years based on your investments at the current moment.
We provide the ability to customize the simulation parameters in the “Settings” section of the page.
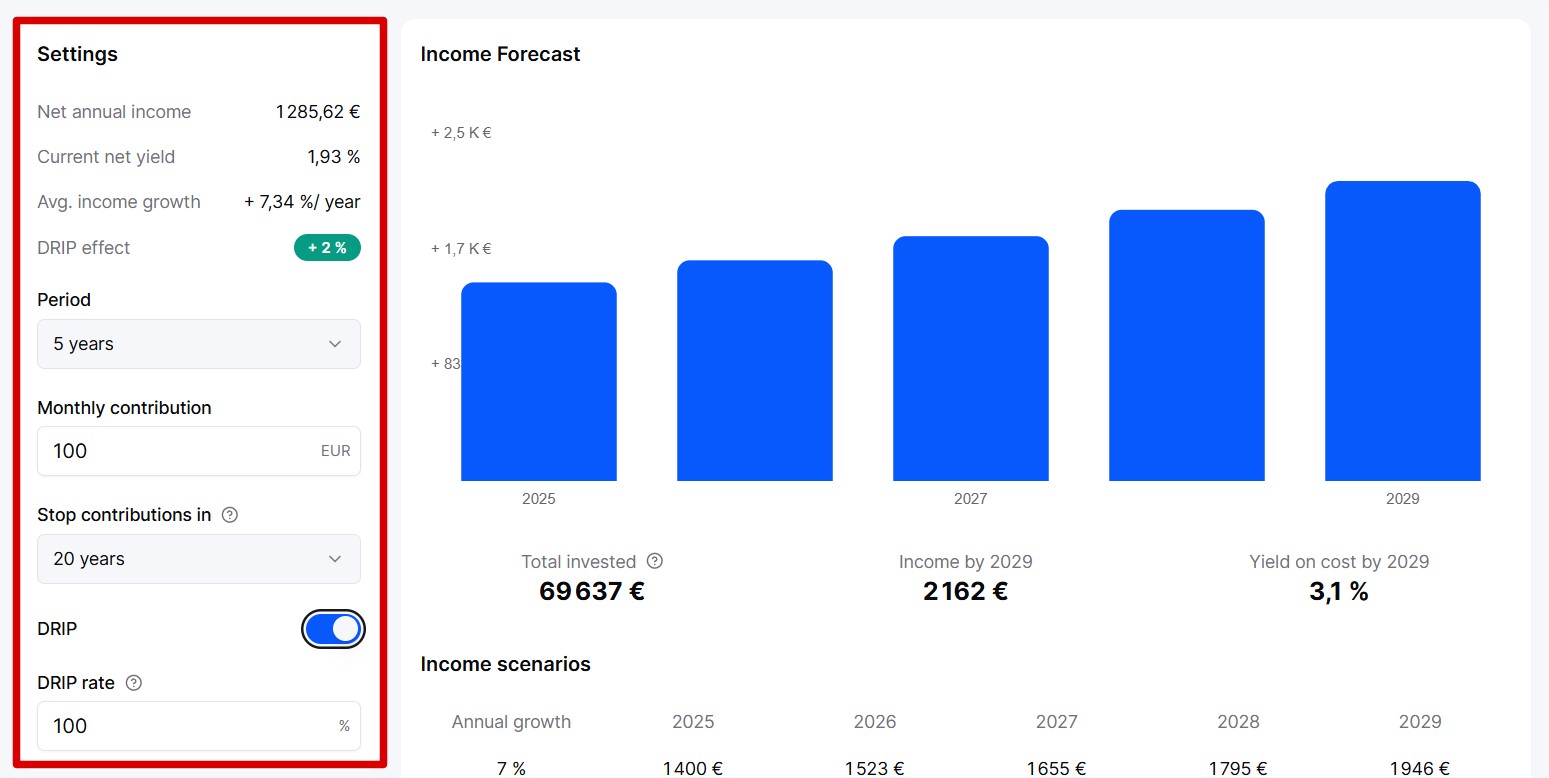
You can specifically edit:
the projected period
your monthly contribution. That is, what you plan to invest every month.
the end of contributions. For the most accurate result, you can determine when you will stop investing monthly.
For example, you can simulate a 30-year period during which you will invest €200 per month for 20 years and then stop contributing.
the reinvestment of dividends (DRIP) or not. If enabled, you can also modify the reinvestment rate. For example, if you set it to 70%, it means that for every dividend you receive, you reinvest 70% into the portfolio and keep 30% for yourself.
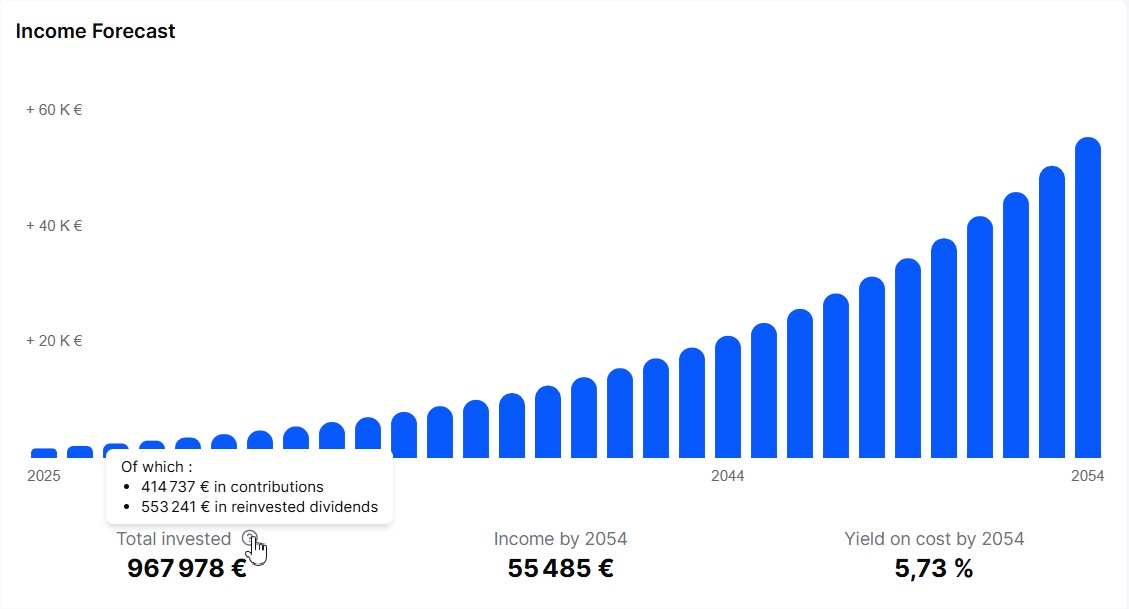
The first thing you see is the graphical simulation of the evolution of your annual income year by year from today to the last year of the selected period.
You also see three main results:
The total invested during the entire period. When hovering over it, you can see the breakdown of this total between the amounts you invested out of pocket (the contributions) and the amounts of dividends you reinvested.
The annual income of the target year (the last year of the projection).
Your yield on cost for the target year. This is the ratio between the amount invested and the annual income.
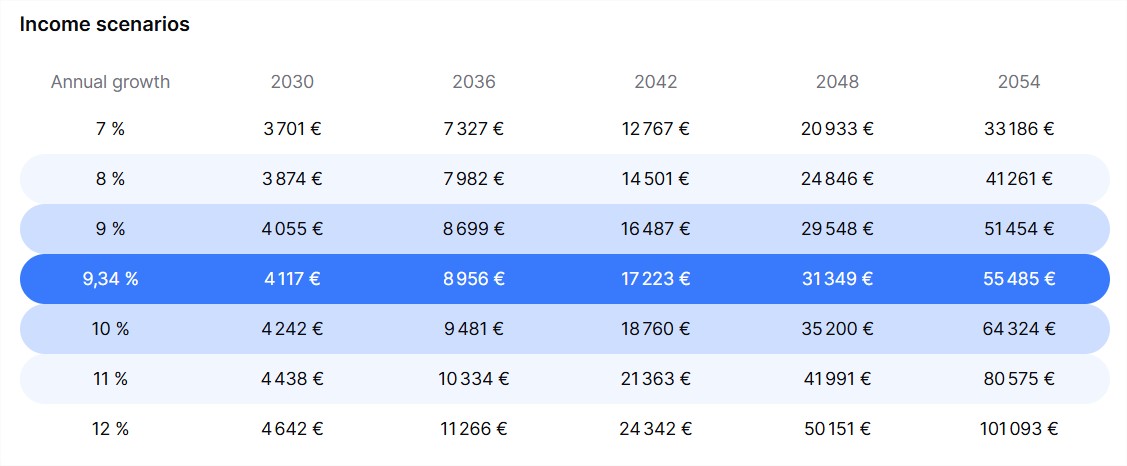
Below the graph, you will find a scenario table of the annual growth of your income based on the selected parameters between pessimistic and optimistic.
In the center in blue is the median scenario, which is used to display the graph above. This table allows you to explore the different possible cases of what your future income might look like.