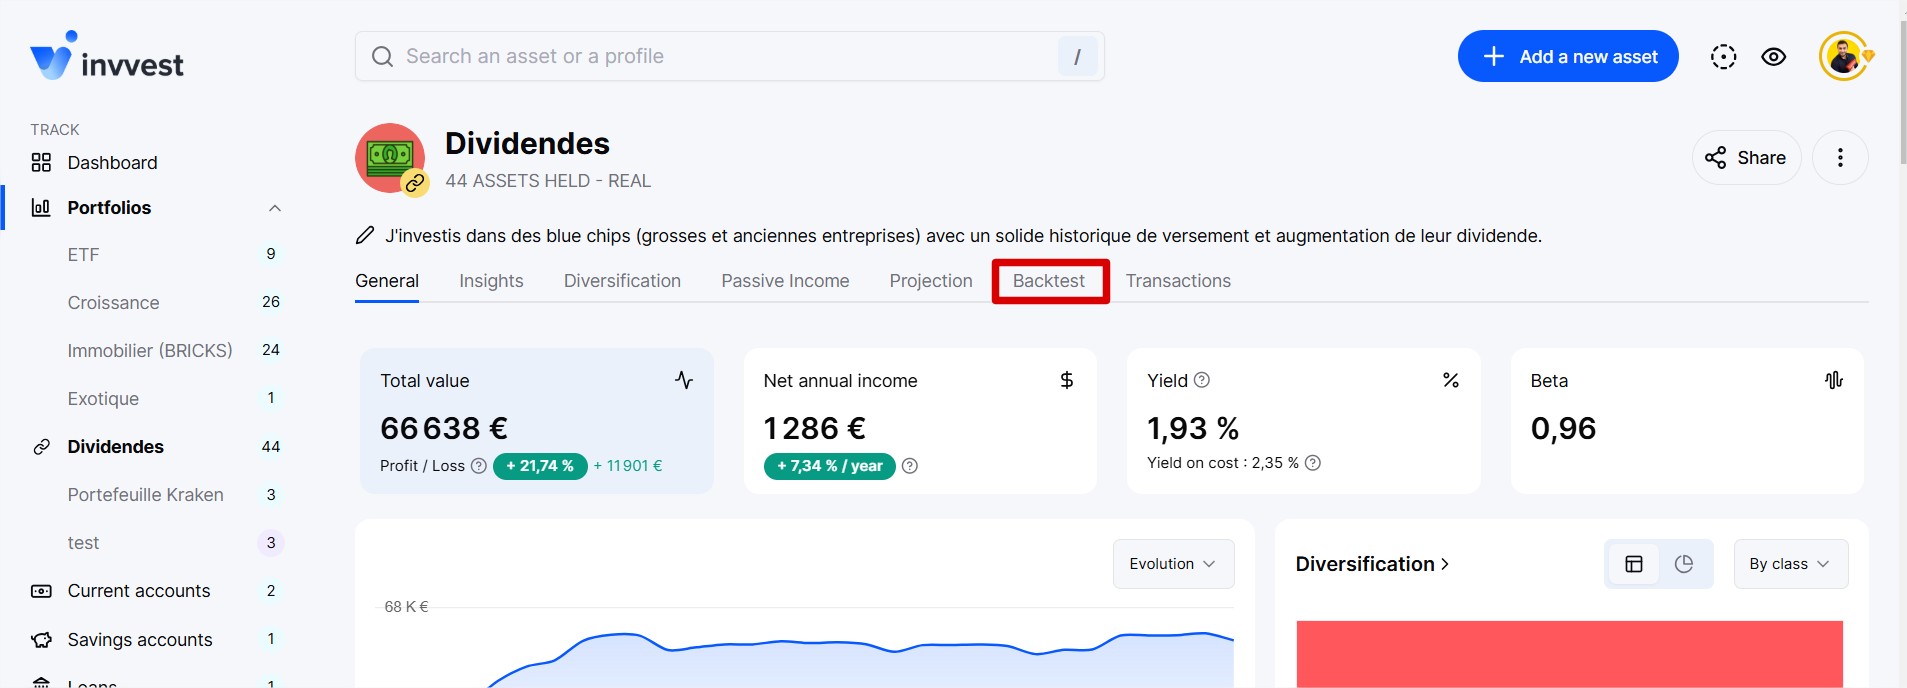
In your portfolios, go to the “Backtest” section.
It is a simulation of the past performance of the assets (stocks, ETFs, SCPI, and cryptos) in your portfolio up to now.
In practical terms, the backtest helps answer a simple question: What would be the current performance of my portfolio if I had bought the assets I hold today 5, 10, or 40 years ago?

We provide the option to customize the simulation parameters in the “Settings” section of the page.
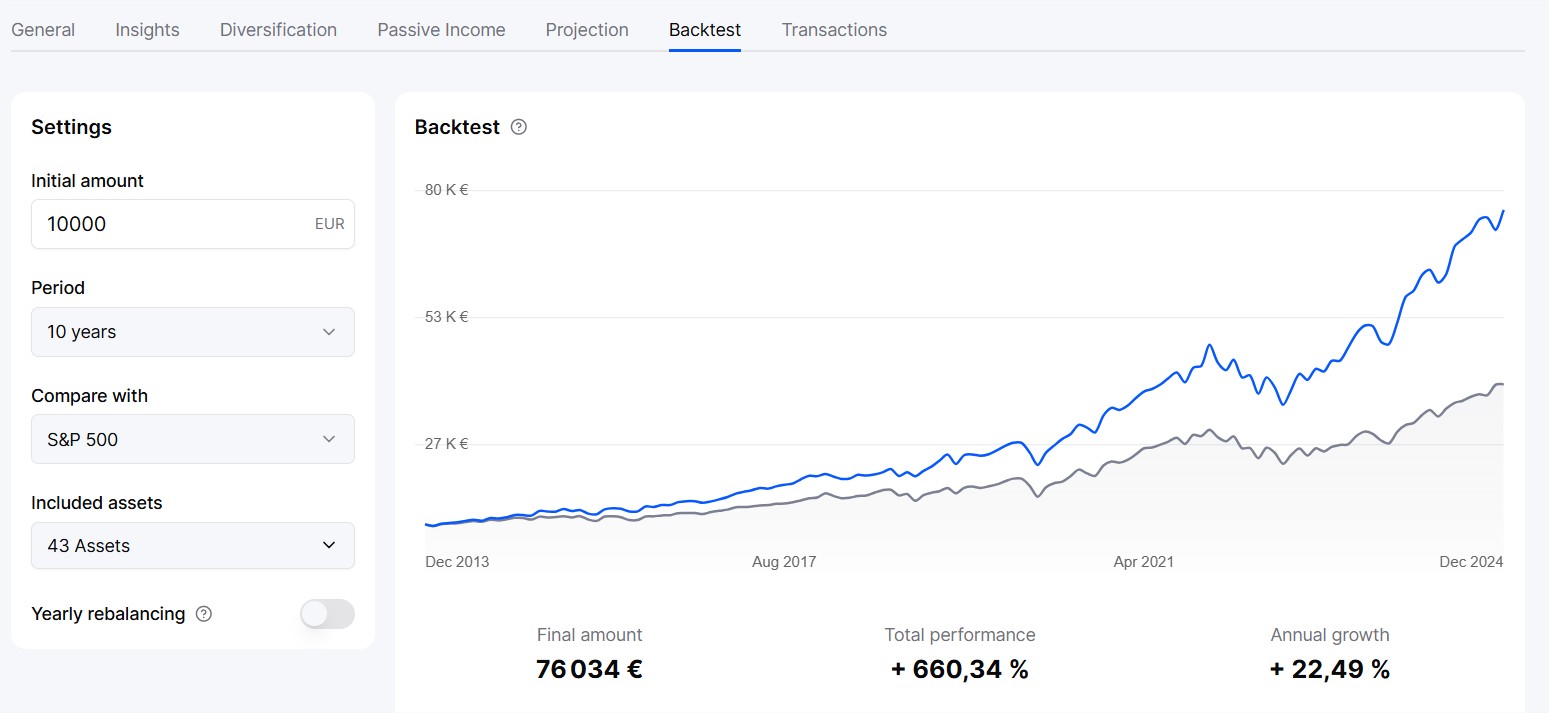
You can change the following:
the initial invested amount
the simulation period
the comparison index
the accounted assets. By default, we activate all assets held within the portfolio, but you can exclude certain assets to see how the simulation reacts without them.
the yearly rebalancing. If enabled, the simulation rebalances the portfolio each year to maintain the initial allocation.
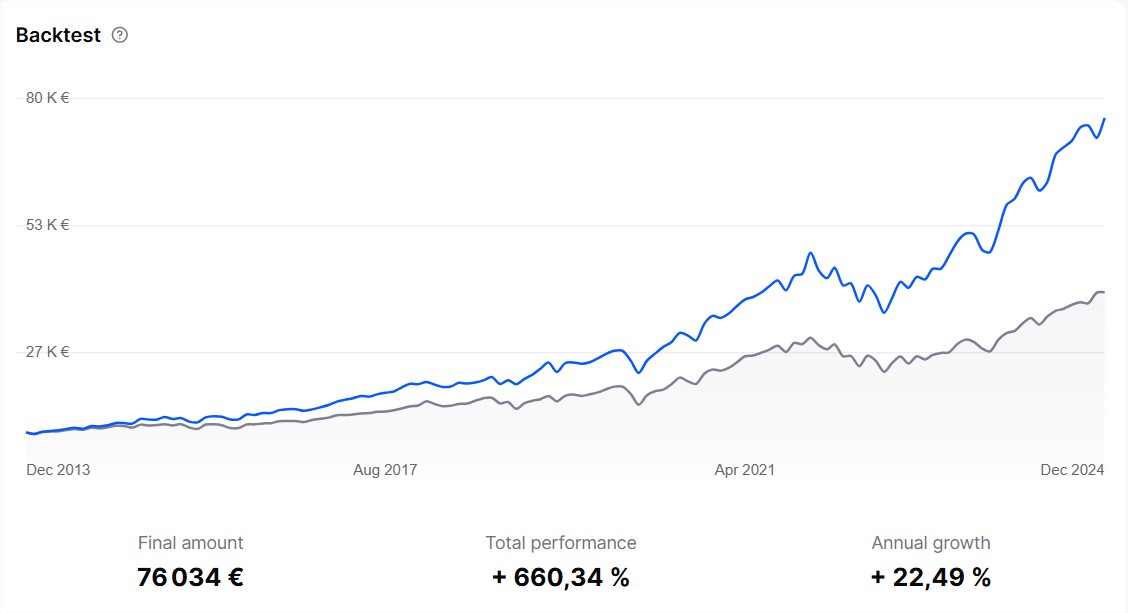
The first thing you see is the simulation in the form of a graph showing the evolution of the invested capital vs the index from the start of the selected period to today. It is therefore a simulation of past performance.
You also see three main results:
The value of the capital at the end of the period
The total performance (by how many % this capital increased over the period)
The annualized performance (by how many % this capital increased on average each year)
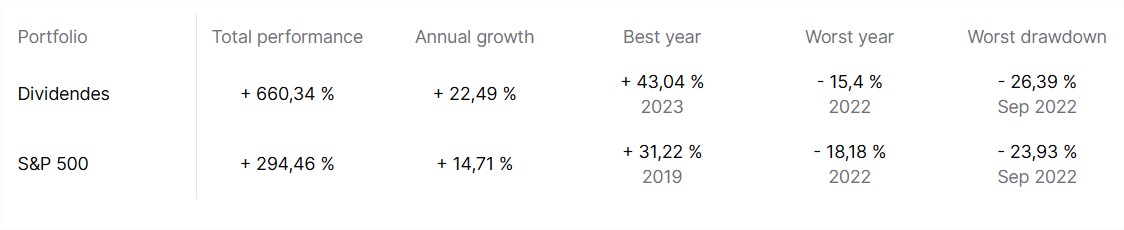
Below the chart, you will find a detailed table of your portfolio's performance compared to the chosen index, with some juicy details such as the best year's performance, the worst year's performance, and the month of the worst drop.
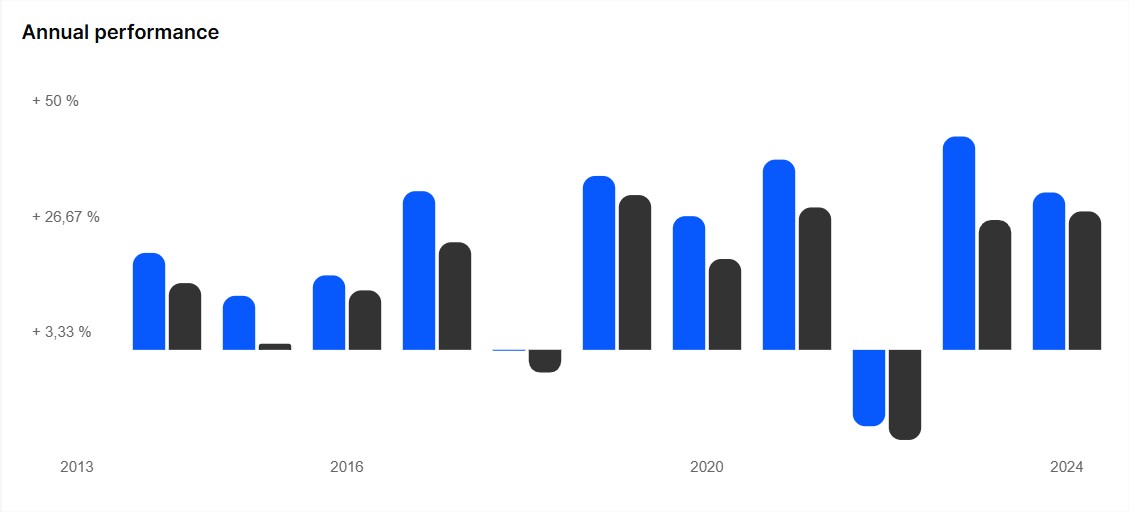
Just below, the performance of each year of the simulation. The idea is to quickly understand which years the portfolio would have performed very well or, on the contrary, very poorly.
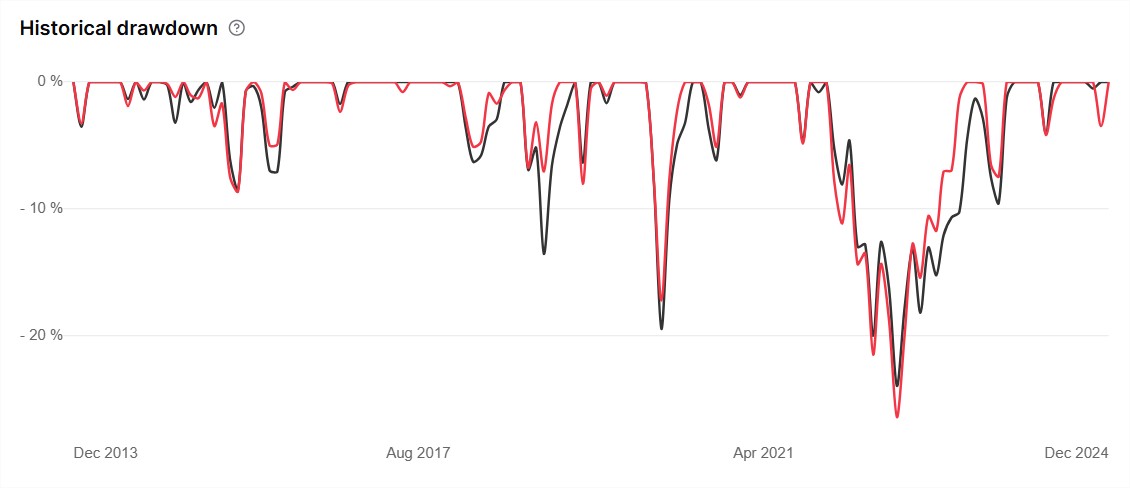
Further below, the historical drawdown, which measures the percentage loss an investment experiences from its last peak to its lowest point. Drawdowns help measure a portfolio's historical risk by highlighting declines (and extreme events).
They allow you to see how a portfolio has performed in the worst situations, in order to assess the maximum level of risk.
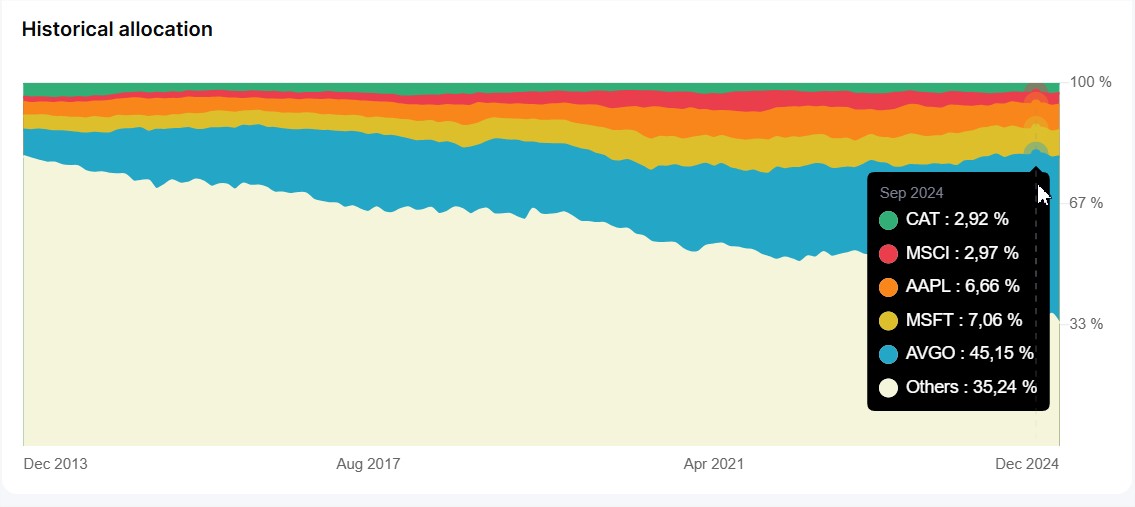
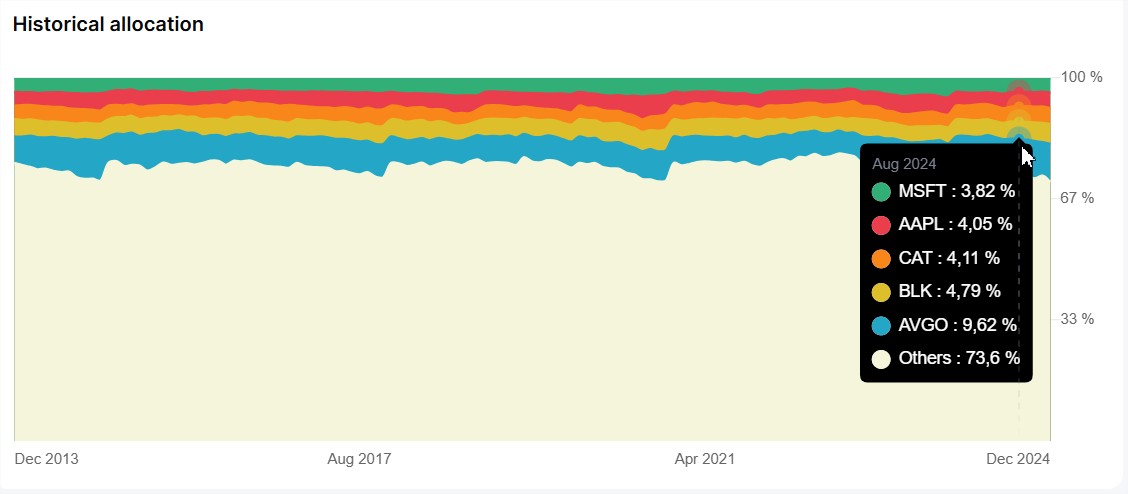
And finally, at the very bottom, the jewel of the Backtest feature that shows you the evolution of the weight of your main assets within your portfolio over time. Giving you an immediate view of the drivers (and brakes) of your final performance.
If you enable rebalancing, you will see how your assets maintain the same initial weight over time.
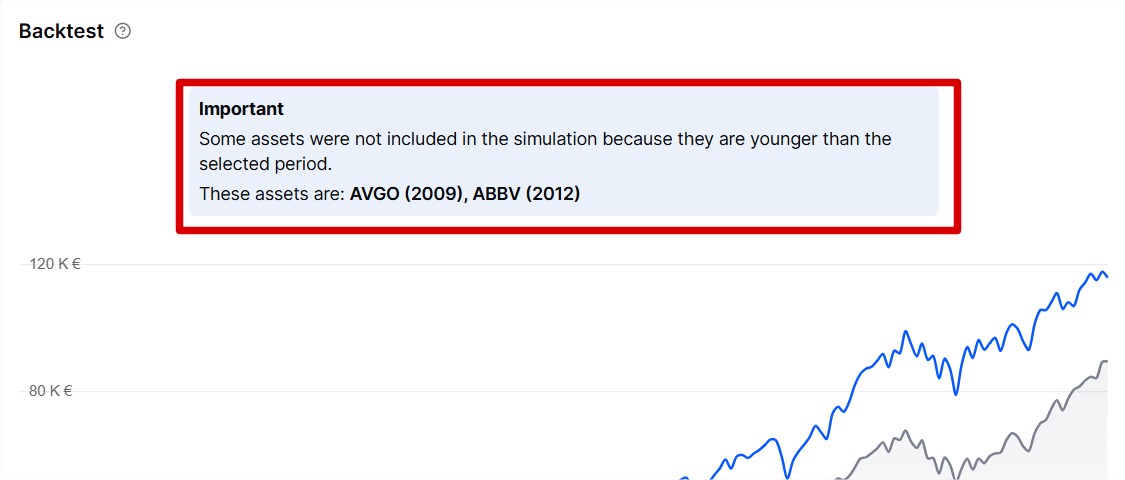
The tool removes from the simulation any assets that are younger than the selected simulation duration.
For example, I want to backtest my portfolio over the last 15 years (since 2008), but Broadcom and Abbvie stocks were not yet listed on the stock exchange at that time. In 2009 and 2012 respectively.
The simulation will indicate it at the very top.