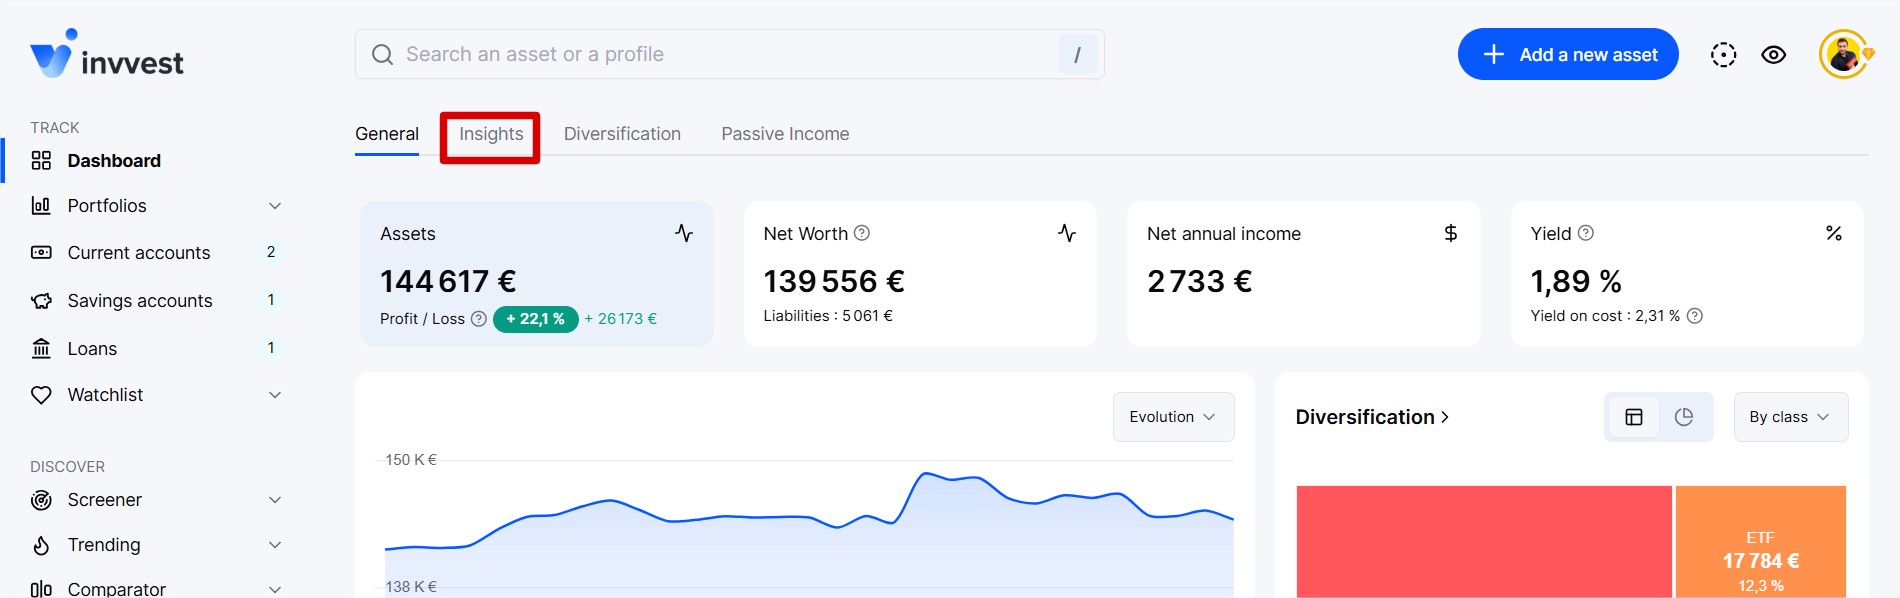
On your dashboard, go to the “Insights” section and scroll all the way down.
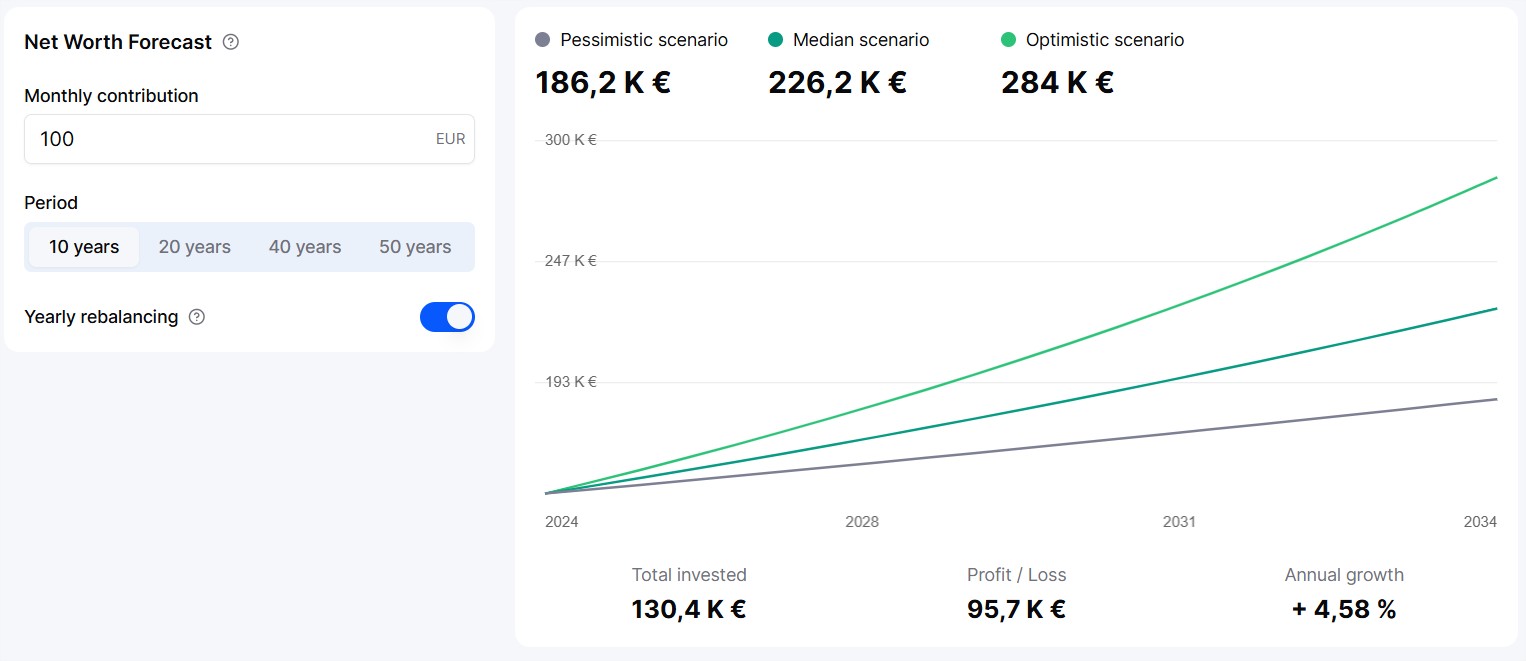
It’s a future simulation of your worth over a chosen period, calculating several scenarios net of inflation and showing you the most pessimistic, the most optimistic, and the median (the most likely).
This simulator takes into account all your assets and is based on their past performance as well as random events.
We provide the option to customize the forecast settings in the “Settings” section of the page.
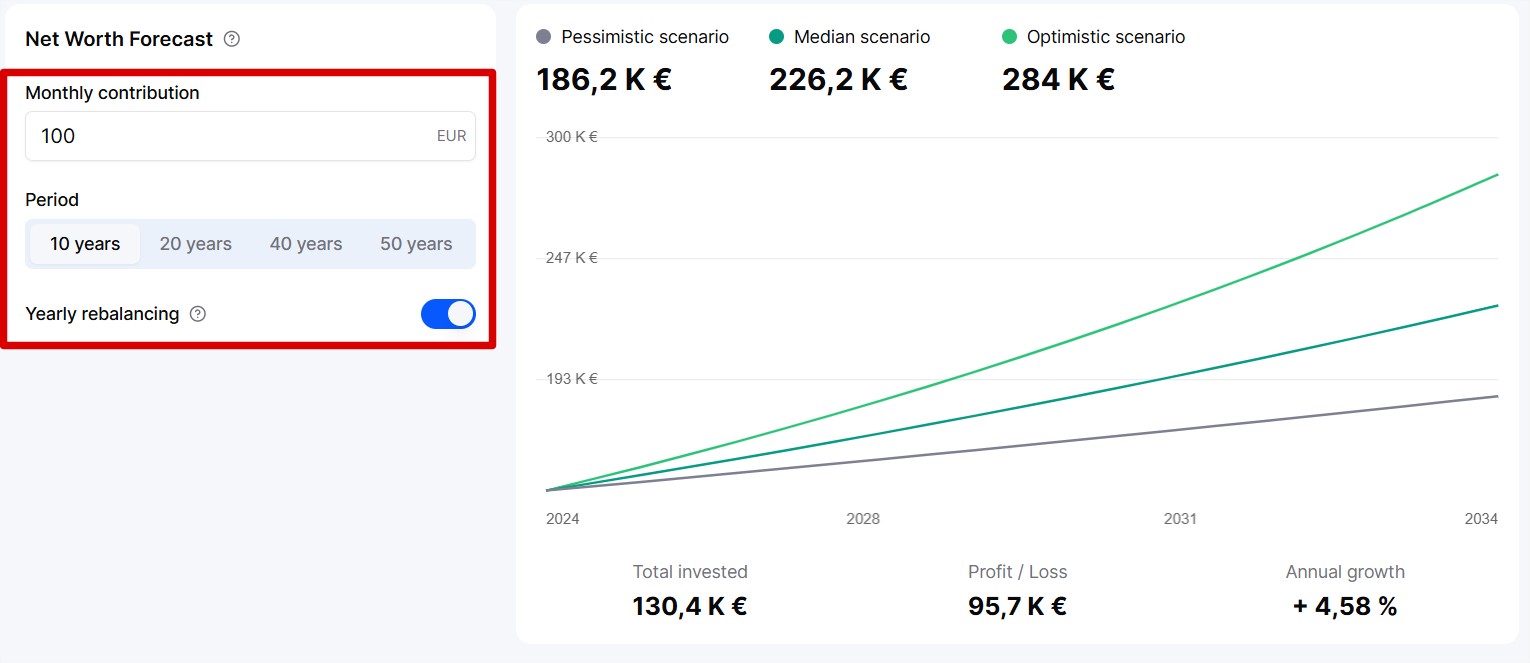
You can edit the following:
your monthly investment contributions
the period to simulate
the annual rebalancing. If enabled, the simulation rebalances the portfolio each year to maintain the initial allocation (i.e., the current allocation).
The first thing presented to you is the value of your portfolio under three scenarios (pessimistic, median, and optimistic). The pessimistic scenario is calculated with low annual performance for each asset held as well as severe random events (major stock market crash, real estate crisis, crypto winter, etc.).
The optimistic scenario, on the other hand, is calculated with optimal performance for each asset held and few random events negatively impacting growth.
Finally, the median scenario is a middle ground with average performance and random events close to modern reality.
Below, you will see the graphical representation of the evolution of wealth according to the 3 scenarios. Then under the graph, 3 indicators of the median final result.
The total amount invested. Calculated with your current invested amount + all your monthly contributions indicated in the simulation settings.
The final profit/loss, which is simply the difference between the total wealth at the end of the period - the total invested.
The annual growth, which is the average % progression (or regression) of your wealth each year of the selected period.