For more than 2,000 companies around the world, we provide exclusive data on segmentation and key performance indicators.
On a stock's page, in the “Exposure” section.
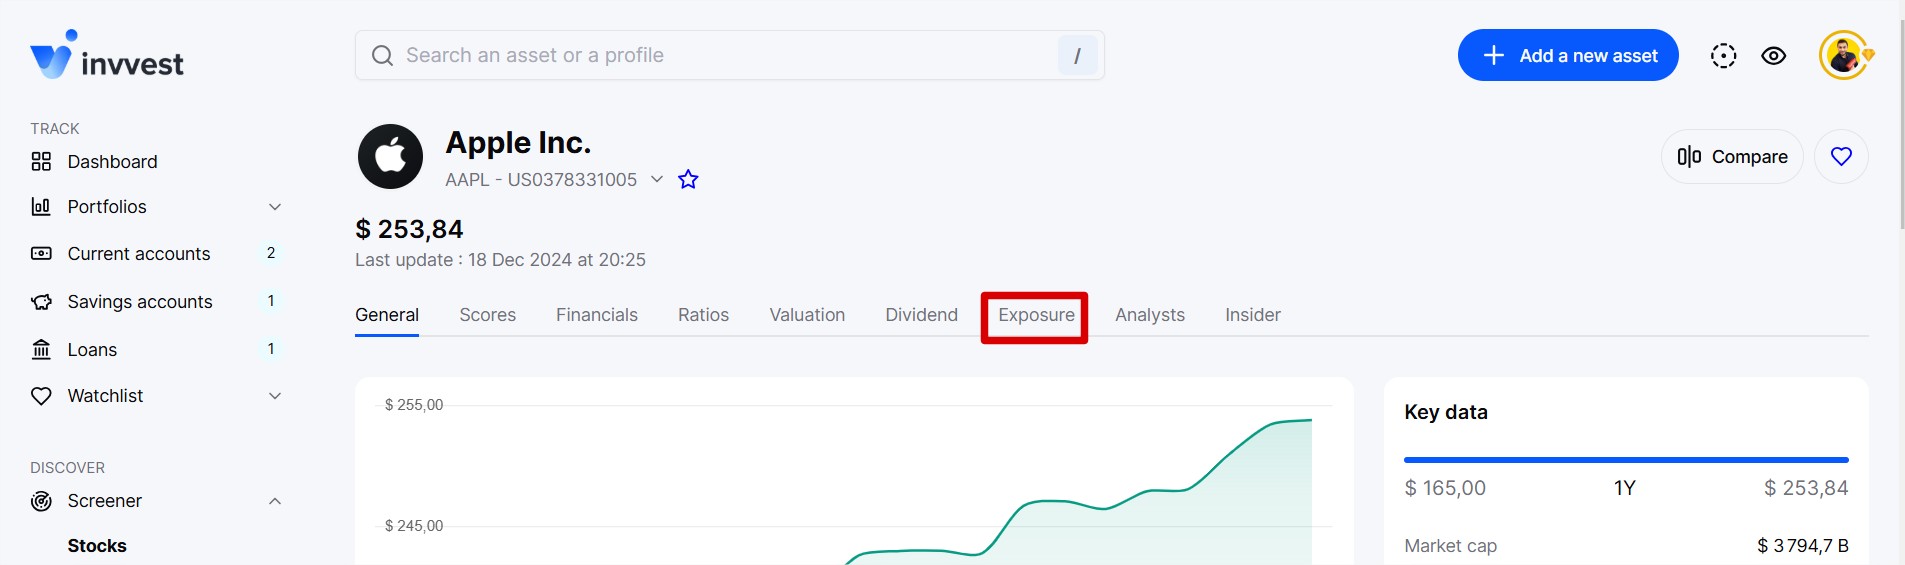
Exposure consists of two subsections:
Segments
KPIs (key performance indicators)
Segments help to understand how and where a company earns money. This is usually the geographic segmentation of revenue or segmentation by products or services. And this is done historically.
Example with the revenue segmentation by geography of Meta.
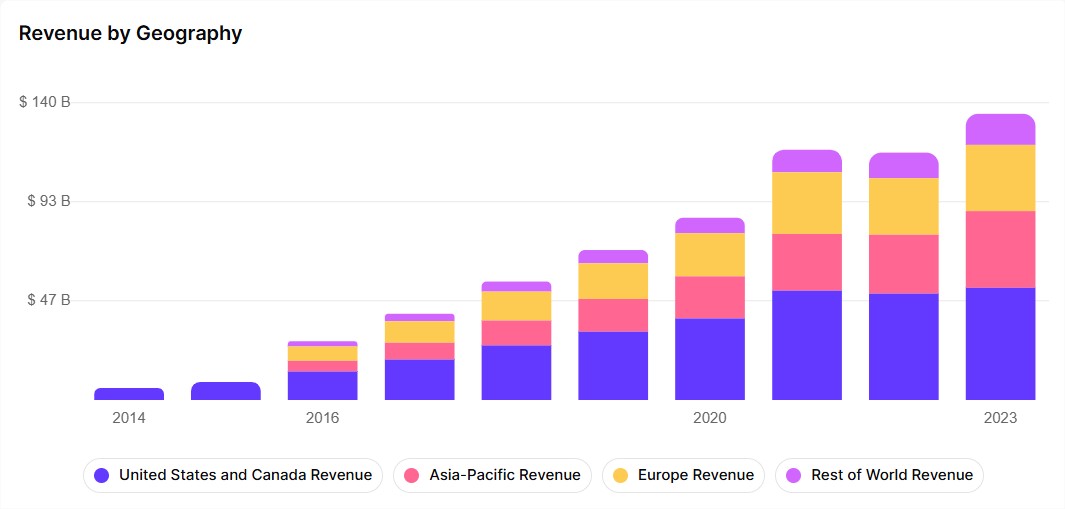
For each year, you see the share and value of revenue from different geographies categorized according to Meta.
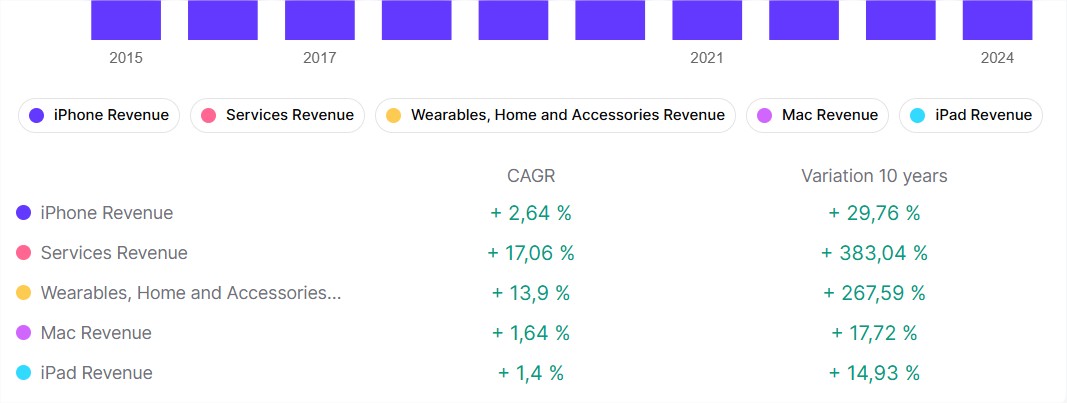
Below each chart, we display the annualized growth rate and the total variation over the period for each item in the legend.
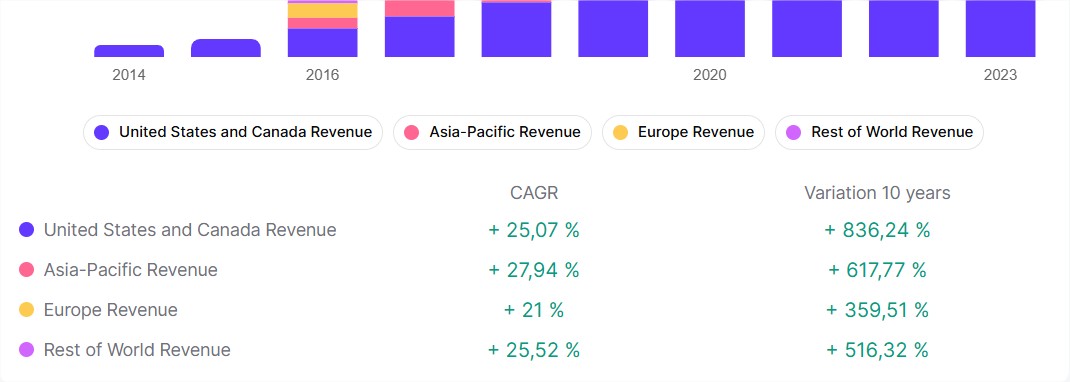
This allows you to quickly identify the geographies or activities experiencing the highest growth, or conversely, those that are lagging behind.
In the example below, we see the growth of Apple's different business activities. We can see that the slowest-growing activity is iPad sales (only +1.4% per year), while the fastest-growing activity is services (iTunes, Apple TV, iCloud, App Store, etc.) with an average sales growth of 17% per year.
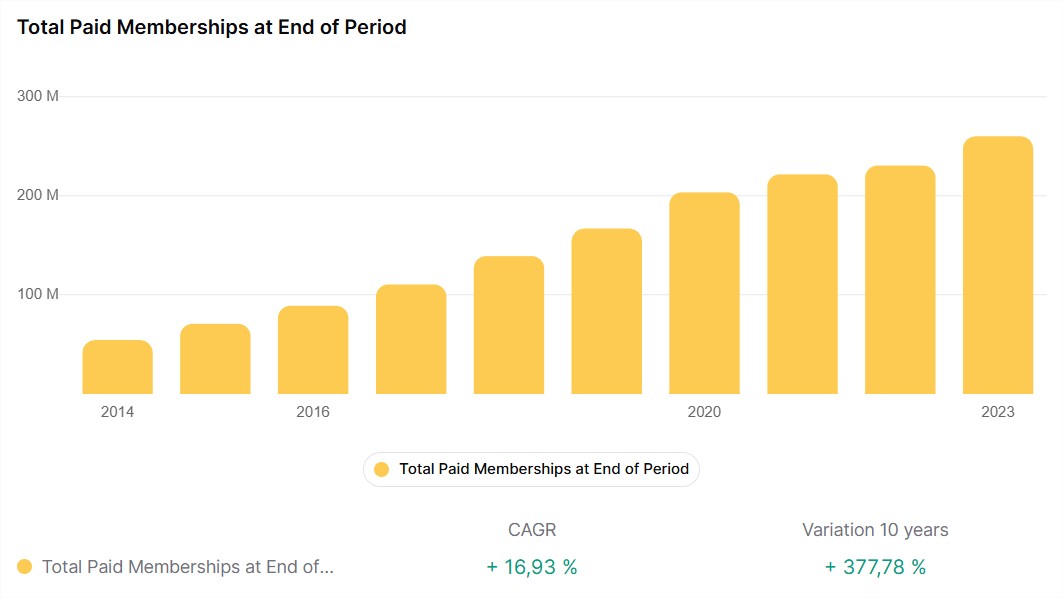
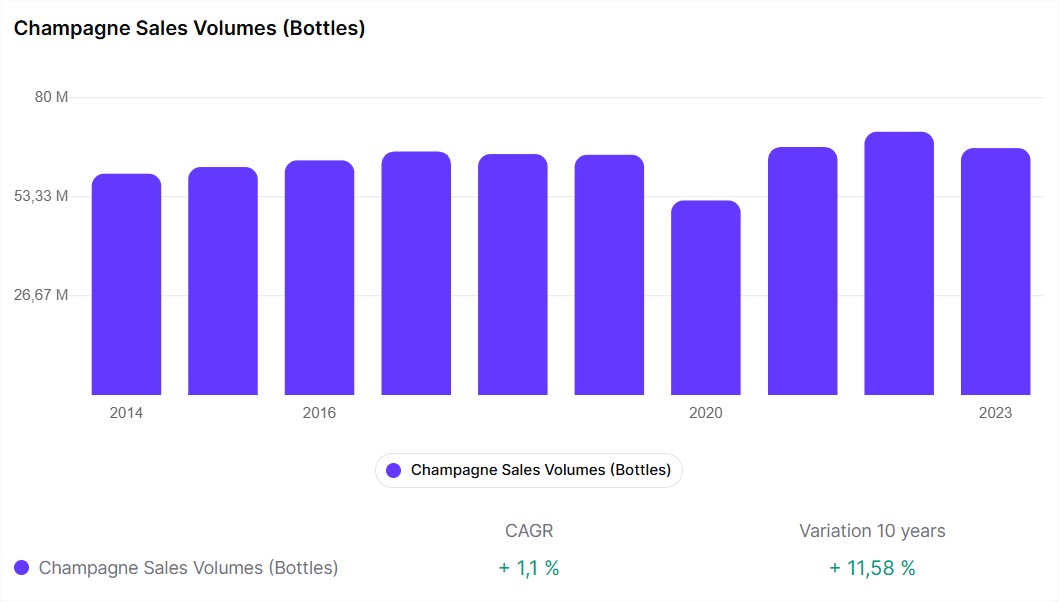
KPIs are indicators specific to each company and defined by the company itself as objectives to monitor and achieve.
For example, the number of champagne bottles sold by LVMH…
Or even the number of paying subscribers on Netflix.