The historical charts displayed on your portfolios evolve every day.
But sometimes, they may take on strange shapes that you might want to correct. This can be caused by:
synchronization issues
deletion of an asset added by mistake or for testing
deletion of an asset you no longer wish to track
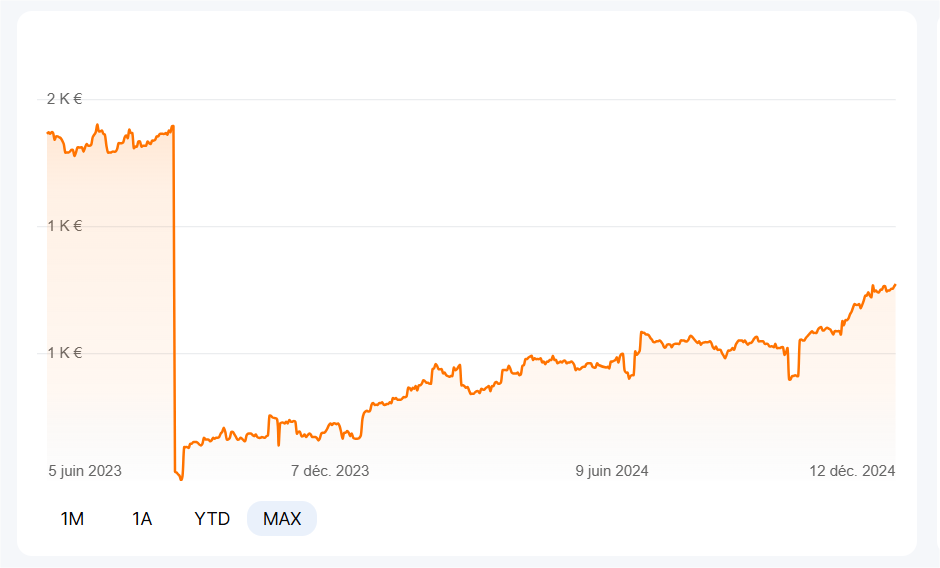
Visually, it might look like this, and we agree that it’s not very appealing.
To address this issue, we give you the ability to correct your charts by deleting date ranges.
Here’s how to do it, it’s very simple.
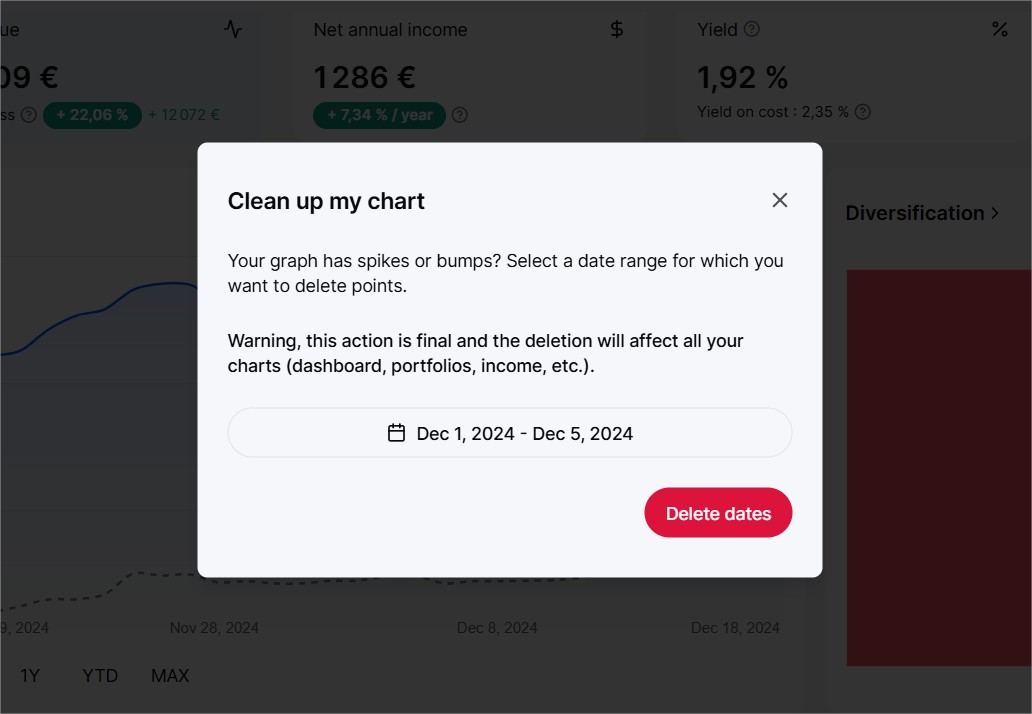
Go to the portfolio whose chart needs to be corrected, then click on the chart.
This will open a date range selection window. Select the date range you want to delete.
Finally, click on the “Delete dates” button. Only the selected dates in the range will be deleted, and the chart will be smoothed over these dates.