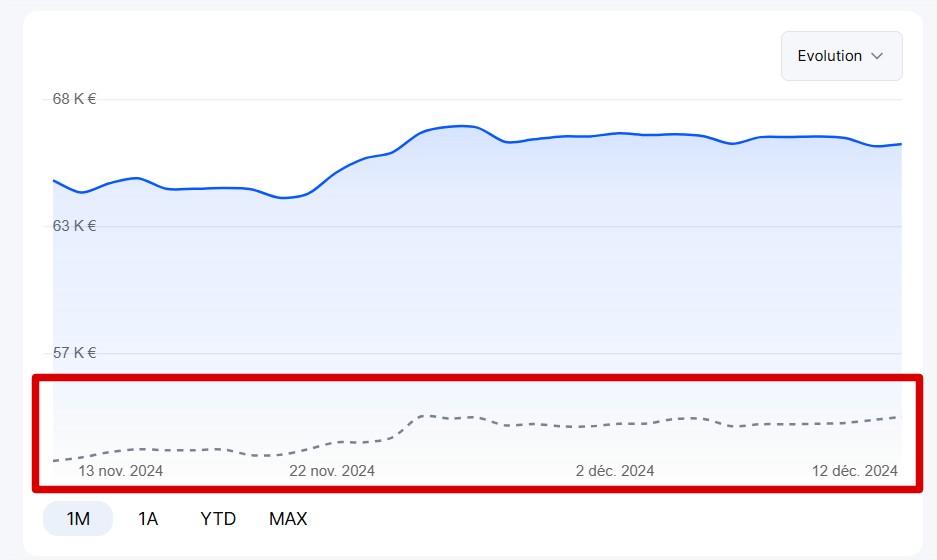
On some of your portfolios, the curve of the invested amount displayed on the historical chart may fluctuate even though you have not made any transactions during the selected period.
It looks something like this:
This situation only occurs on portfolios containing assets in currencies other than that of the portfolio (for example, you have a portfolio in euros in which you buy stocks in dollars).
The reason is simple: the exchange rate.
To understand what’s happening, you need to know that the invested amount is simply your average purchase price x quantity. For example, you bought 10 Apple shares at $200 each, your invested amount will be $2,000.
Since your portfolio is in €, we convert these $2,000 into euros, which gives us €1,910 that we record on your invested amount chart.
The next day, to record the new point of the invested amount on the chart, we repeat the same calculation. $200 x 10 = $2,000. We convert these $2,000 into euros, and this time, it gives us €1,980.
A €70 difference compared to the previous day, even though you didn’t make any transactions, simply because the EUR/USD exchange rate changed overnight.
This is why the curve of the invested amount can fluctuate on some of your portfolios.
This can be confusing and may even impact your unrealized gains/losses, which might differ from those displayed by your broker. But it’s simply another way of viewing a portfolio’s performance by taking currency fluctuations into account.