Watchlists on Invvest are much more than just simple lists of assets you have "liked."
We’ve supercharged them with insights to help you better analyze assets and make better decisions.
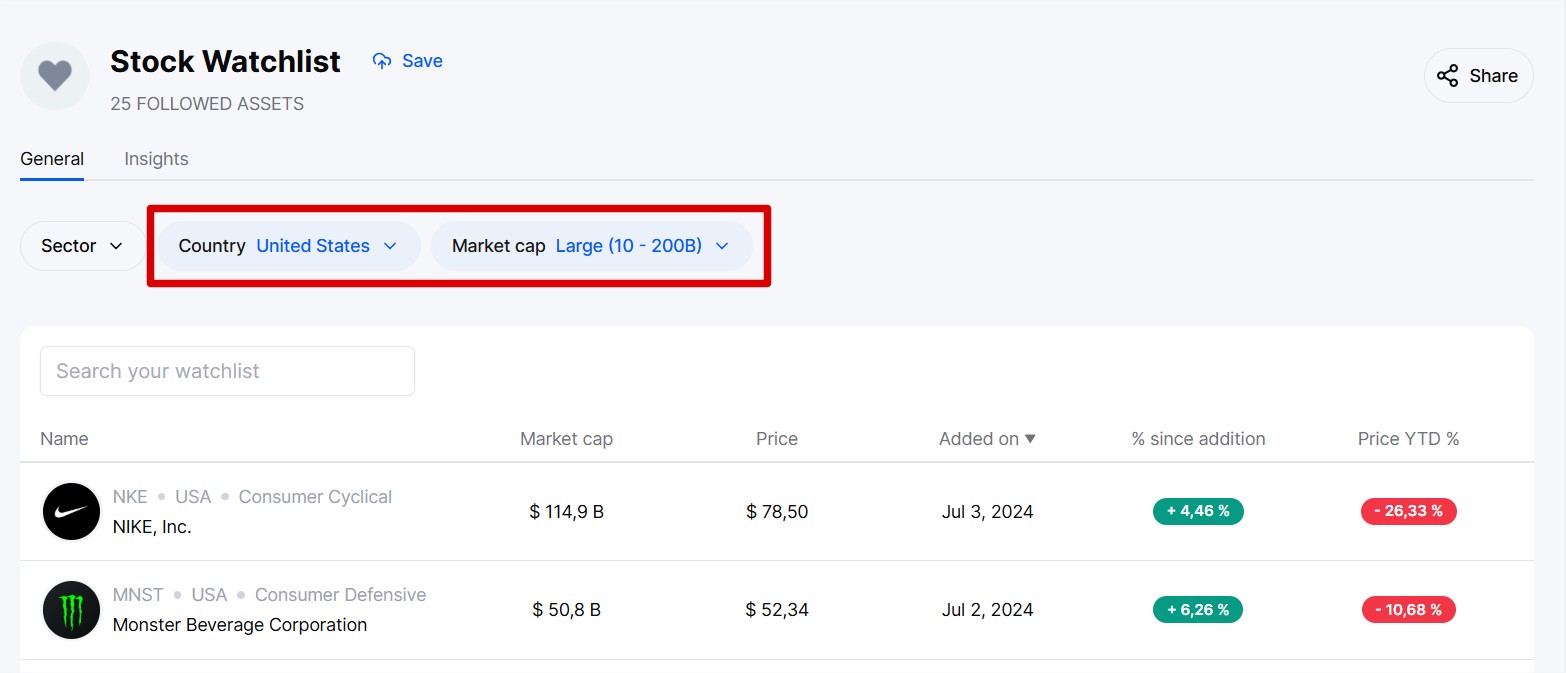
First cool feature: filters.
If your watchlist starts getting long, it can become difficult to browse through and find what you’ve added.
So, we’ve added some filters to make your life easier.

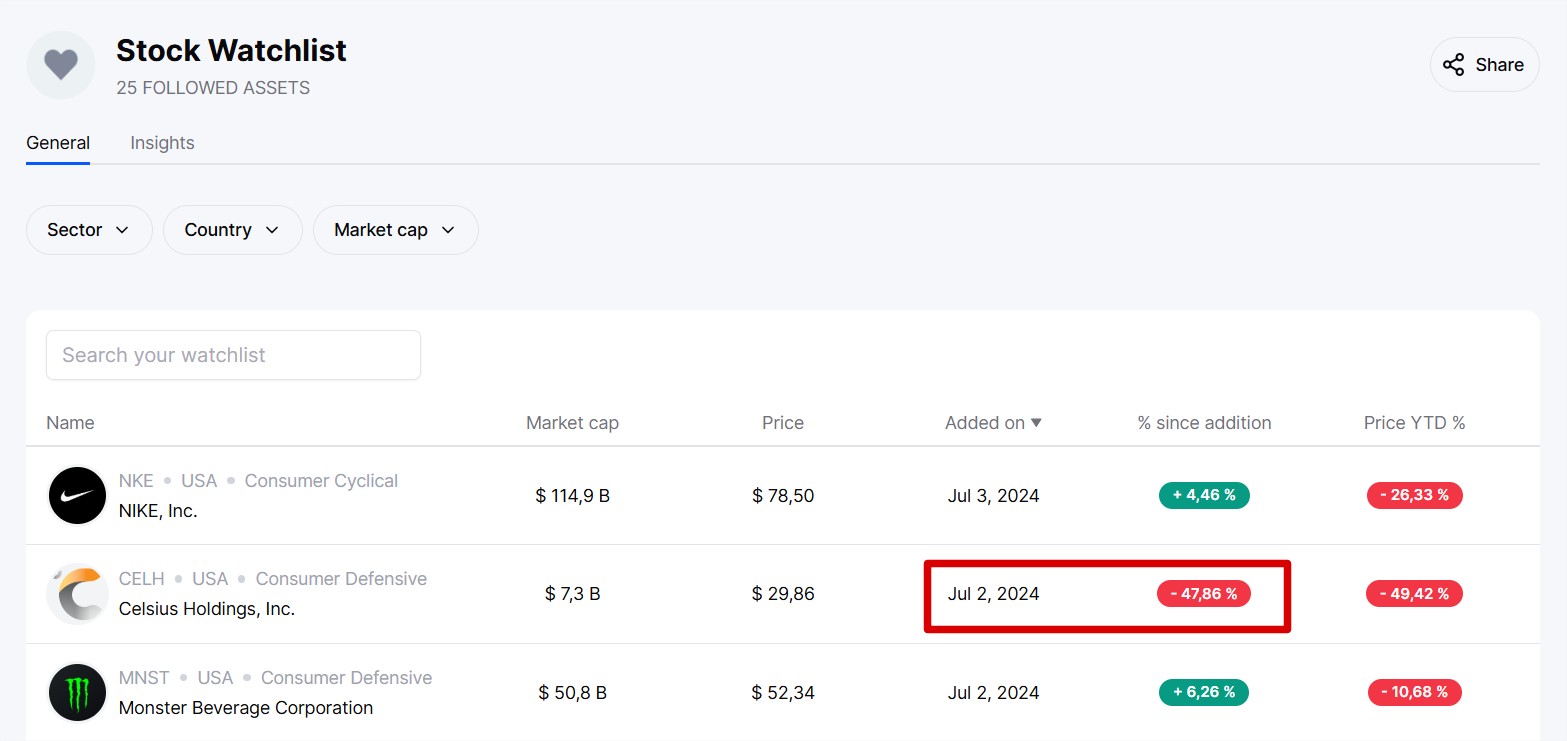
Another cool thing we’ve implemented: saving and displaying the date an asset was added to the watchlist.
This allows you to recontextualize the asset by remembering when you added it and tracking the price evolution of the asset since the addition date.
In the example below, we see that I added Celsius Holdings stock to my watchlist on July 2, 2024, and since that date until today (December 2024), the stock has dropped by 47%. Luckily, I didn’t buy it in July, and it might now be interesting to consider investing in it.
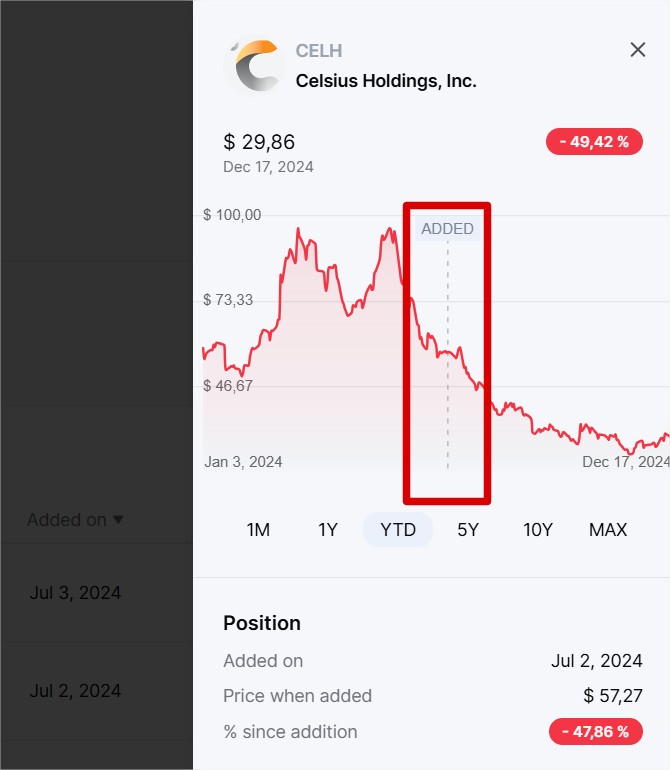
By clicking on the asset, you will be able to see the same data but in a graphical format for better historical context.
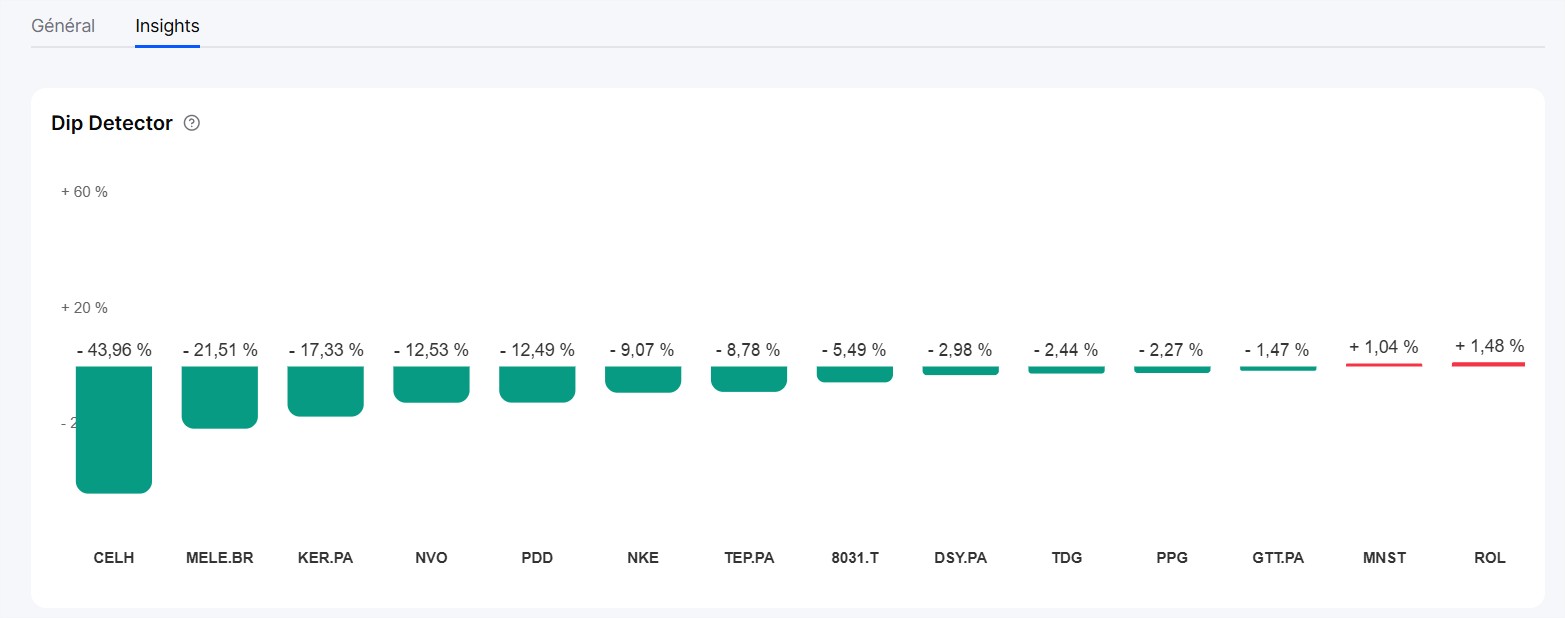
As with portfolios, the Dip Detector is accessible from the "Insights" section of your watchlist.
Specifically, it is a chart that shows the percentage difference between the price of a stock (or ETF or crypto) and its 200-day moving average. As the name suggests, the moving average is the average price of the stock over the last 200 days.
It is a technical indicator that helps reveal the upward or downward trend of a stock. If the price of a stock is above its moving average, it indicates that it is in an upward trend. If it is below, it indicates that it is in a downward trend.

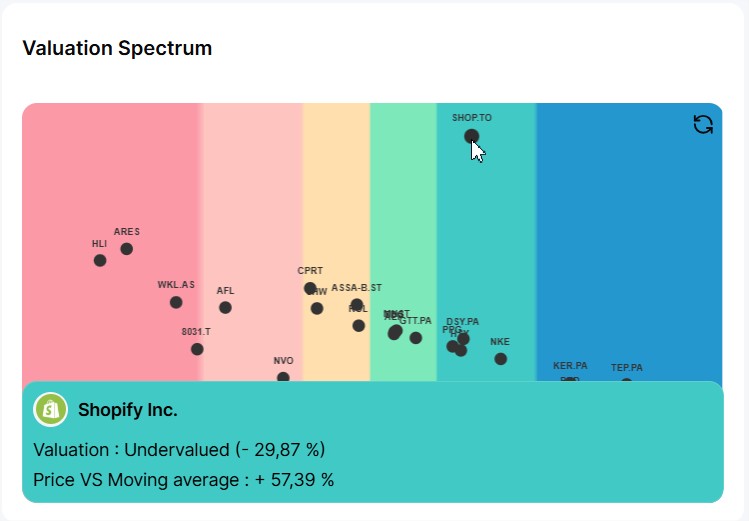
The Valuation Spectrum is a chart that shows you at a glance how all the stocks in your watchlist are valued.
This valuation is determined using our own analysis algorithm based on several financial indicators and ratios.
The further to the left the stock is, the more overvalued it is (horizontal axis). The higher the stock is, the more its price exceeds its moving average (vertical axis).
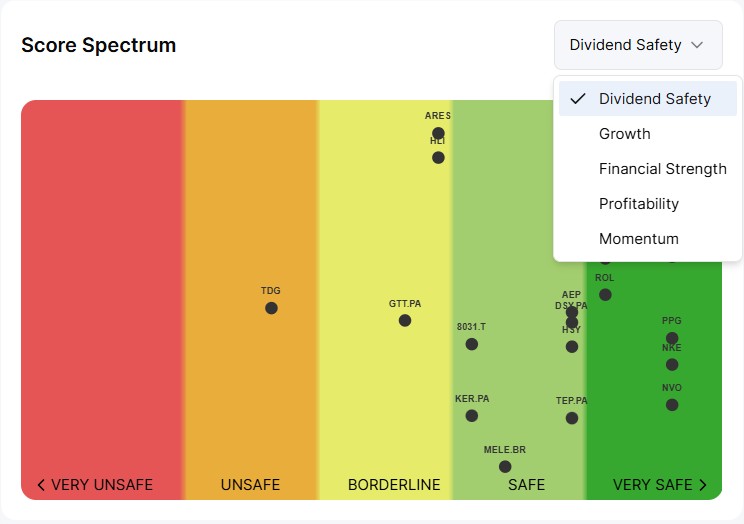
The Score Spectrum is a chart that shows you at a glance how all the stocks in your watchlist are rated according to our 5 proprietary scores (Dividend Safety, Growth, Health, Profitability, and Momentum).
These scores are calculated using our own analysis algorithms based on dozens of financial indicators and ratios.
The further to the right the stock is, the better its score (horizontal axis). The higher the stock is, the more its price exceeds its moving average (vertical axis).